Predictive Analytics for NHL Contracts
This study combines NHL player statistics, player contract information, and economic data to predict a player’s value- locally adjusted for a specific team
Introduction
There comes a point in every season of every professional sport where teams, analysts, and fans are forced to speculate on contract signings and roster moves. With more data being published every day, I wanted to compare the performance of complex Neural Networks to Linear and Multiple Linear Regression for predicting a player’s value as a percentage of the NHL’s current salary cap. There is nothing novel about simply attempting to predict player contracts, so I decided to add economic data for every city that hosts an NHL team in an attempt to adjust a player’s salary based on actual take-home pay. I believe that this can add an additional layer of insight because from a player’s perspective, it doesn’t matter if you sign a contract for more money in a different city if you’ll be taking less of that money home after taxes and a higher cost of living.
The Data
In the data folder of the GitHub repository, you will find four CSV files:
SkaterStats.csv- Contains basic statistics from NHL.com/stats for all active players
CapFriendly.csv- Contains contract and salary cap data from CapFriendly.com for all active players
Taxes.csv- Contains tax and cost of living data for each city that is home to an NHL team
The above files are imported into RStudio to clean and prepare the data.
The R Markdown file can be found in the GitHub repository for the project if you want to see the steps taken to clean and combine the data
If you would rather skip to the analysis, I have also included the processed data file that gets exported from RStudio
CleanHockeyData.csv- Contains the combined, processed, and exported data from RStudio that is used for analysis in Python
The Process
Data Preparation
-
I reduced the data down to a single record for each individual player for the season they signed their current contract.
- Each record needed to include the player’s statistics for that season plus the season prior to signing because this allows us to see how their performance might have changed from season to season
-
Then, I used the raw hockey statistics to create per game, per minute, and per 60 minutes versions of each of the original statistics to try to control for things like ice time and injuries, which are out of the players’ control.
- I wound up sticking with just the per 60 minutes statistics for the analysis because it generated better predictions than the raw statistics, and the results were easier to interpret than breaking things down to a per minute basis.
-
The data was further reduced to only include players with a minimum of 25 games played because a good handful of the players had a few really good games before getting injured or reassigned to a different league, which skews their per 60 minute rates for the season.
Analysis
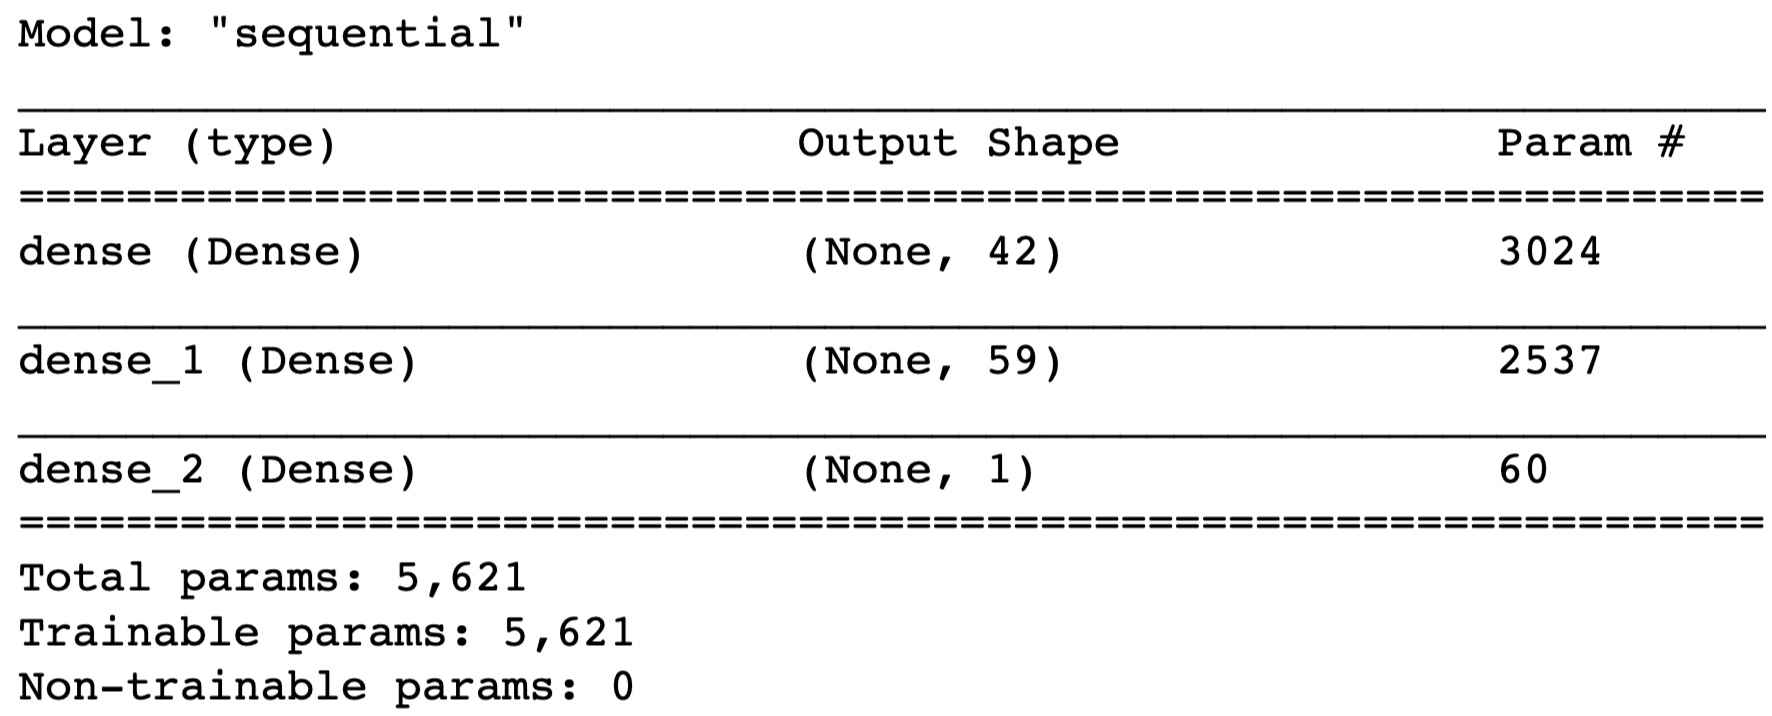
- The neural network was built with Keras and uses all of the features in the dataset:
Next, I had to test the correlation of all the features to figure out which one(s) have the highest correlation with the target (Percentage of Cap Space), so I could use those features for regression.
-
Simple linear regression used Assists Per 60 Minutes since it had the highest correlation with the target.
-
Multiple linear regression used Assists Per 60 Minutes plus the next six features that had the highest correlation with the target
Results
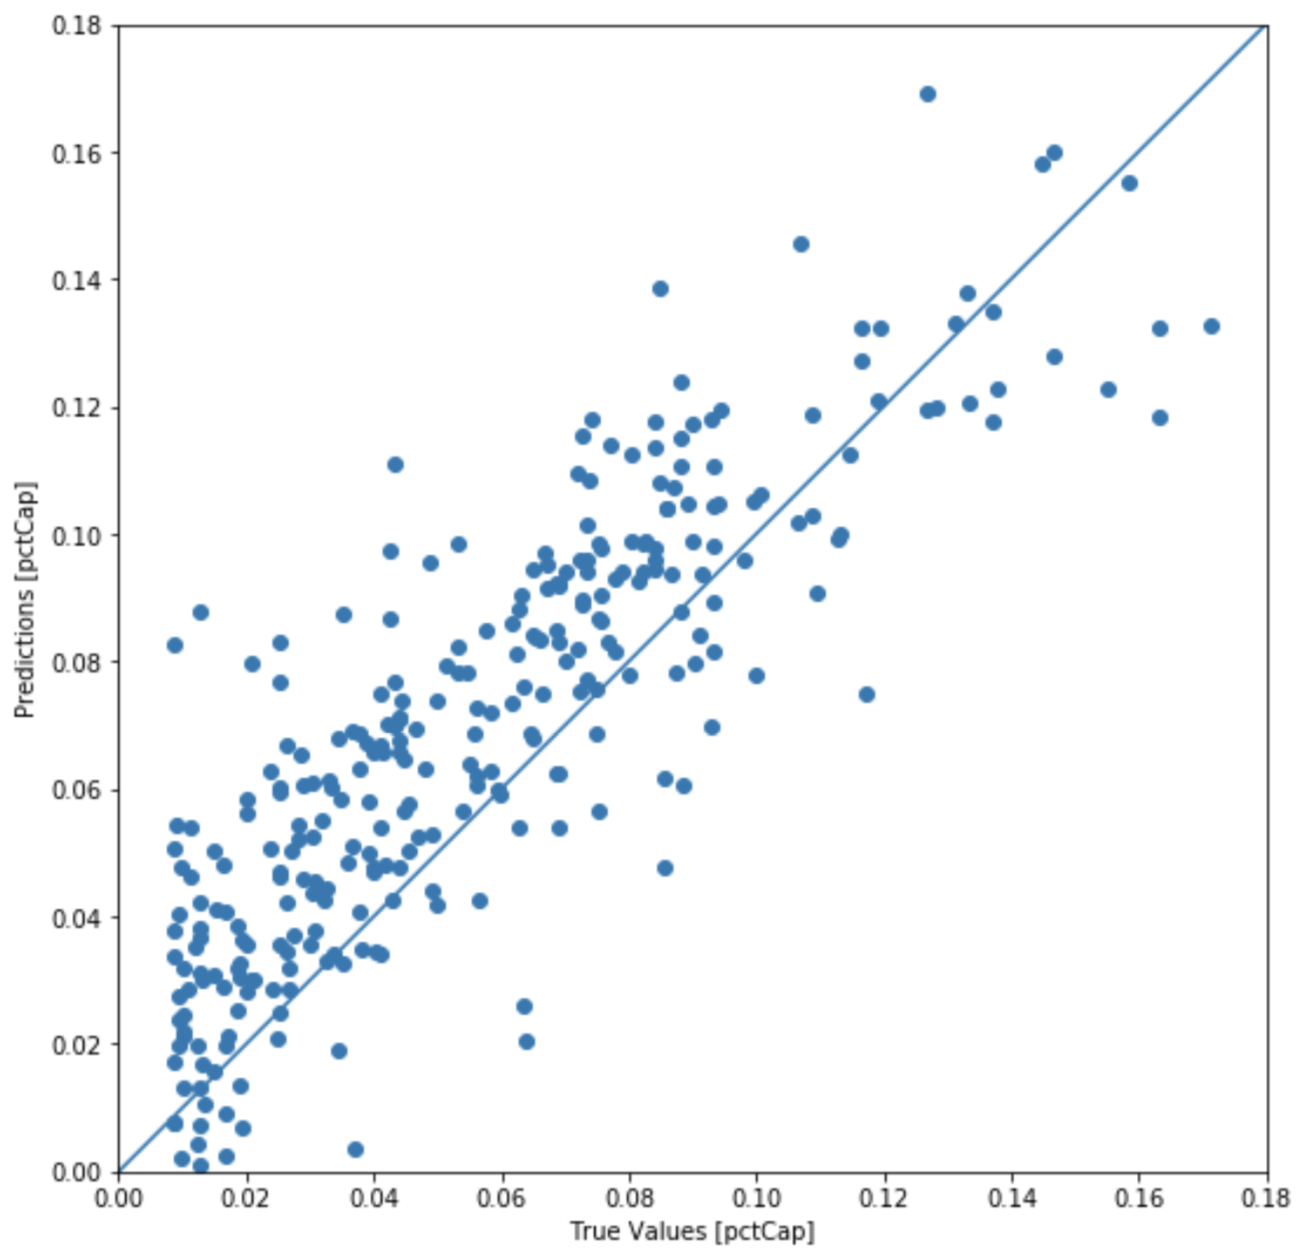
Surprisingly, multiple linear regression wound up narrowly outperforming the neural network in terms of prediction accuracy. However, none of the models appear to be effective enough to make reliable player valuations.
Target Variable = pctCap
mean(pctCap) = 0.0552

Multiple Linear Regression = 0.014824140704958222
Neural Network = 0.019025536688456527
Simple Linear Regression = 0.023563290128380265
Author
Xander Hieken
Acknowledgements
The hockey analytics Twitter community is extremely helpful and supportive of anyone looking to learn more about hockey, statistics, or sports analytics in-general.
I want to be sure to specifically thank the following accounts that provided data and inspiration for this project. It wouldn’t have been possible without:
-
Evolving-Hockey: @EvolvingHockey on Twitter and Evolving-Hockey.com
-
Hockey-Graphs: @HockeyGraphs on Twitter and Hockey-Graphs.com
-
CapFriendly: @CapFriendly on Twitter and CapFriendly.com